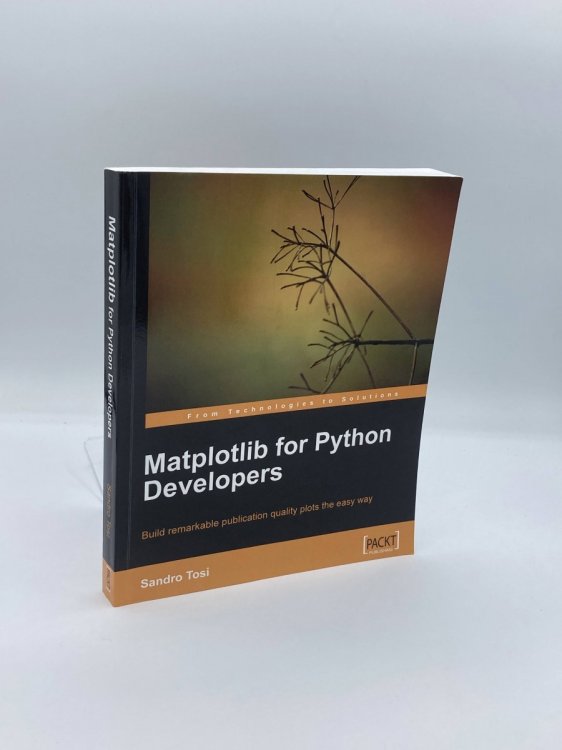
Matplotlib for Python Developers
$35.99 USD • Used
Book contains highlighting from previous owner. Book contains markings and notes from previous owner. Otherwise in great condition. ; - We're committed to your satisfaction. We offer free returns ...
Store: TrueOakBooksLLC [View Items]
Book contains highlighting from previous owner. Book contains markings and notes from previous owner. Otherwise in great condition. ; - We're committed to your satisfaction. We offer free returns and respond promptly to all inquiries. Your item will be carefully wrapped in bubble wrap and securely boxed. All orders ship on the same or next business day. Buy with confidence.
From Publisher:
Providing appealing plots and graphs is an essential part of various fields such as scientific research, data analysis, and so on. Matplotlib, the Python 2D plotting library, is used to produce publication-quality figures in a variety of hardcopy formats and interactive environments across platforms. This book explains creating various plots, histograms, power spectra, bar charts, error charts, scatter-plots and much more using the powerful Matplotlib library to get impressive out-of-the-box results.Product Info
ISBN: 1847197906
ISBN-13: 9781847197900
Publisher: Packt Publishing
Year: 2009
Type: Used
Binding: Softcover
Seller Info
TrueOakBooksLLC
Address: 574 New Paltz Rd Highland, New York
Website: https://www.trueoakbooks.com
Country: United States


